Print any Salesforce report to PDF — with its chart
Report PDF Studio is a Salesforce app (managed package) that renders a saved Lightning report into a clean, branded PDF: the report's own chart, the filters that were applied, the groupings, subtotals and grand totals, and the detail rows.
Salesforce's Printable View exports to a spreadsheet without the chart, and report subscriptions attach only .xlsx or .csv files.
Report PDF Studio closes that gap in one click.
What it does
- Render Report to PDF — pick a saved tabular, summary or matrix report (or open the "Report to PDF" utility while you look at a report).
- Run-time filters — change the report's filter values, the date range, "My / All records" and the standard filters, or add filters, before you print. The PDF prints a "Filters applied" block, so readers know exactly what they see.
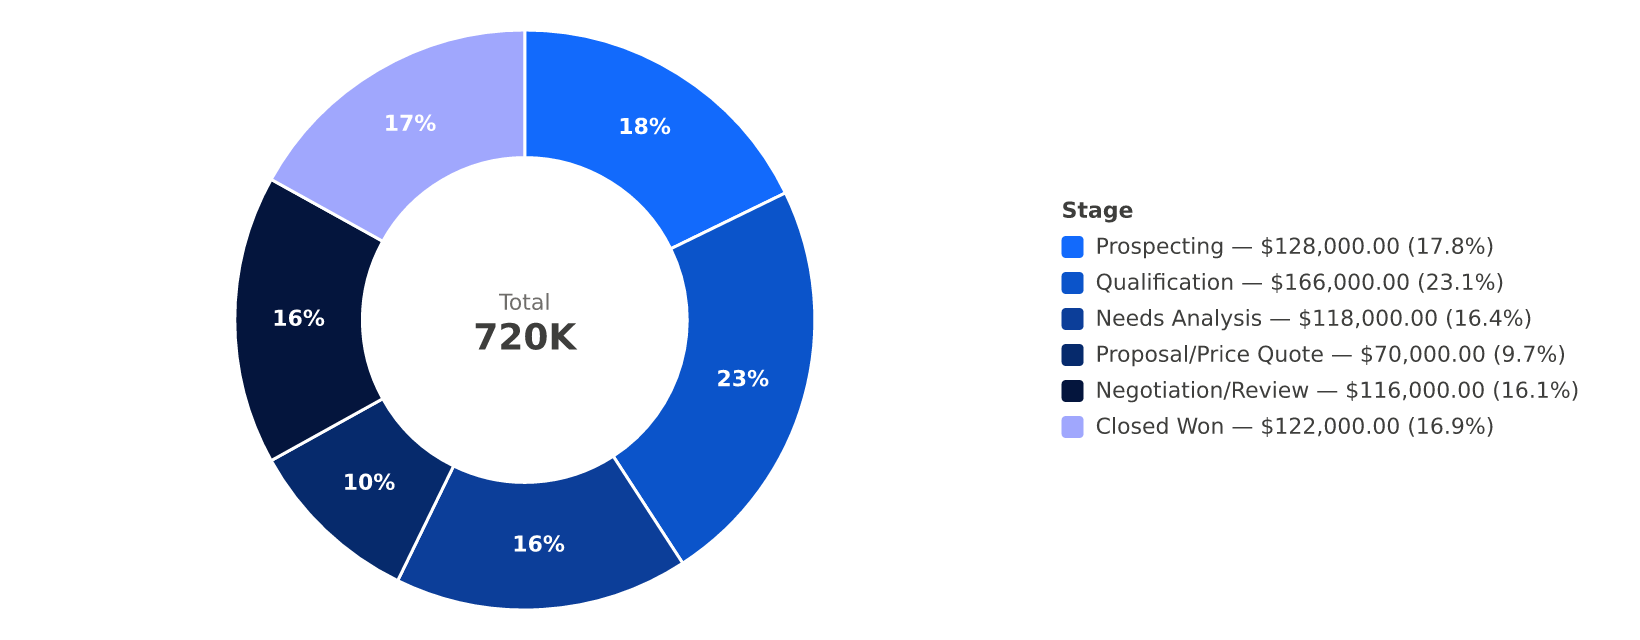
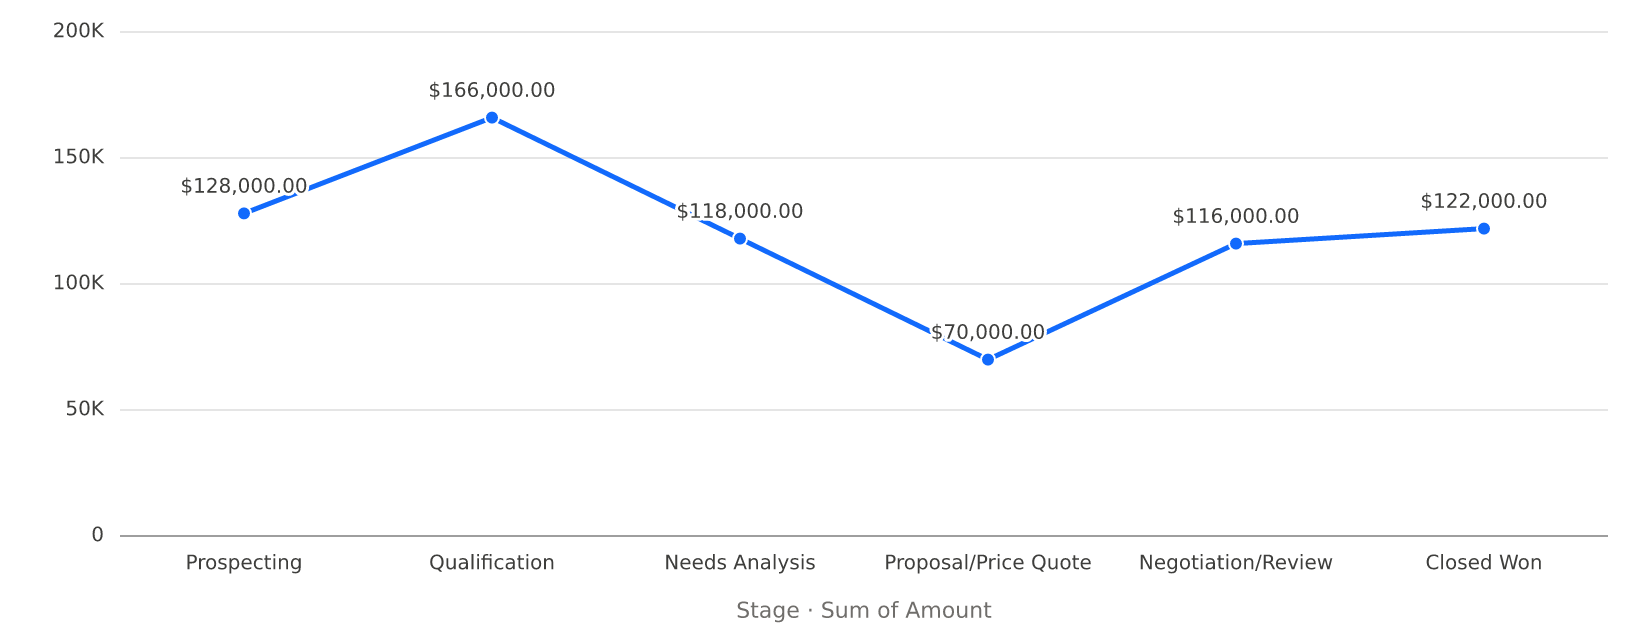
- The report's chart — the chart saved on the report is drawn in the PDF with the report's own colors: bar, column, stacked, grouped and funnel charts are drawn inside Salesforce. Pie, donut and line charts are drawn by the optional chart renderer (below).
- Preview, download, email — preview in Lightning, download the PDF, or email it to Salesforce users and allowed addresses.
- Schedules — weekly, daily or monthly PDFs by email. Each schedule runs as its owner.
- History and retry — every PDF job is a record with the source report, filters, row count, chart type, errors and a retry button.
- Admin controls — branding profiles (page size, orientation, logo, header, footer, accent color, font, row limit), allowed email domains, automatic retries and the chart renderer switch.
- Flow action — "Render Report to PDF" for record-triggered and scheduled flows.
Permission-aware by design
Reports run with the Apex Reports API as the user who asks for the PDF (or as the schedule owner): record sharing, field-level security and report folder access apply. Nothing is copied out of Salesforce, except the optional chart renderer call below.
The chart renderer (this server)
The Visualforce PDF engine supports CSS 2.1 only — no SVG and no inline images — so curved charts cannot be drawn inside Salesforce.
When an admin turns it on, Report PDF Studio sends only the chart's group labels and totals (never detail rows, record Ids or user data)
to POST /api/v1/charts/render on this server and gets a PNG back. Nothing is stored or logged.
Example (fictional data):
Get started
See the setup guide. Questions: support.